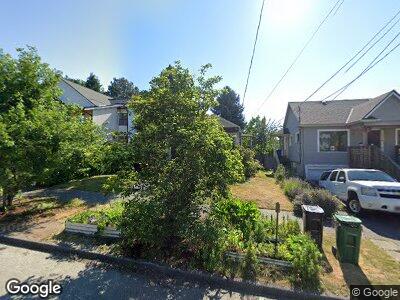
7738 Mary Ave NW Seattle, WA 98117
Whittier Heights NeighborhoodEstimated Value: $1,015,000 - $1,191,000
3
Beds
2
Baths
1,020
Sq Ft
$1,056/Sq Ft
Est. Value
About This Home
This home is located at 7738 Mary Ave NW, Seattle, WA 98117 and is currently estimated at $1,077,266, approximately $1,056 per square foot. 7738 Mary Ave NW is a home located in King County with nearby schools including Whittier Elementary School, Whitman Middle School, and Ballard High School.
Ownership History
Date
Name
Owned For
Owner Type
Purchase Details
Closed on
Apr 23, 2020
Sold by
Wilcynski Christine
Bought by
Wilcynski Christine and Wilcynski John Michael
Current Estimated Value
Home Financials for this Owner
Home Financials are based on the most recent Mortgage that was taken out on this home.
Original Mortgage
$801,000
Outstanding Balance
$729,956
Interest Rate
3.6%
Mortgage Type
New Conventional
Estimated Equity
$362,205
Purchase Details
Closed on
Sep 27, 2019
Sold by
Intawong Kalan
Bought by
Wilcynski Christine
Purchase Details
Closed on
Aug 9, 2006
Sold by
Cotton Kathleen
Bought by
Intawong Kalan and Intawong Christine Wilcynski
Home Financials for this Owner
Home Financials are based on the most recent Mortgage that was taken out on this home.
Original Mortgage
$45,000
Interest Rate
6.33%
Mortgage Type
Stand Alone Second
Create a Home Valuation Report for This Property
The Home Valuation Report is an in-depth analysis detailing your home's value as well as a comparison with similar homes in the area
Home Values in the Area
Average Home Value in this Area
Purchase History
| Date | Buyer | Sale Price | Title Company |
|---|---|---|---|
| Wilcynski Christine | -- | Old Republic Title Ltd | |
| Wilcynski Christine | -- | None Available | |
| Intawong Kalan | $450,000 | Fidelity Natio |
Source: Public Records
Mortgage History
| Date | Status | Borrower | Loan Amount |
|---|---|---|---|
| Open | Wilcynski Christine | $30,000 | |
| Open | Wilcynski Christine | $801,000 | |
| Previous Owner | Intawong Christine Wilcynski | $386,789 | |
| Previous Owner | Intawong Chris Wilcynski | $70,100 | |
| Previous Owner | Wilcynski Intawong Christine | $411,000 | |
| Previous Owner | Intawong Kalan | $45,000 | |
| Previous Owner | Intawong Kalan | $360,000 | |
| Previous Owner | Cotton Kathleen | $200,000 |
Source: Public Records
Tax History Compared to Growth
Tax History
| Year | Tax Paid | Tax Assessment Tax Assessment Total Assessment is a certain percentage of the fair market value that is determined by local assessors to be the total taxable value of land and additions on the property. | Land | Improvement |
|---|---|---|---|---|
| 2024 | $9,013 | $895,000 | $800,000 | $95,000 |
| 2023 | $8,082 | $812,000 | $734,000 | $78,000 |
| 2022 | $7,643 | $889,000 | $693,000 | $196,000 |
| 2021 | $7,424 | $792,000 | $659,000 | $133,000 |
| 2020 | $7,663 | $731,000 | $387,000 | $344,000 |
| 2018 | $7,168 | $780,000 | $412,000 | $368,000 |
| 2017 | $6,105 | $698,000 | $371,000 | $327,000 |
| 2016 | $5,648 | $612,000 | $325,000 | $287,000 |
| 2015 | $4,870 | $553,000 | $291,000 | $262,000 |
| 2014 | -- | $486,000 | $239,000 | $247,000 |
| 2013 | -- | $448,000 | $221,000 | $227,000 |
Source: Public Records
Map
Nearby Homes
- 8014 14th Ave NW
- 8025 14th Ave NW
- 7543 15th Ave NW
- 8045 Mary Ave NW
- 8049 Mary Ave NW
- 7500 15th Ave NW Unit E
- 8015 12th Ave NW
- 7757 11th Ave NW
- 7348 15th Ave NW
- 8305 13th Ave NW Unit B
- 1216 NW 83rd St
- 1220 NW 83rd St
- 8304 13th Ave NW Unit B
- 8333 14th Ave NW Unit B
- 8335 14th Ave NW Unit A
- 8335 14th Ave NW Unit B
- 8322 16th Ave NW Unit D
- 8322 16th Ave NW Unit A