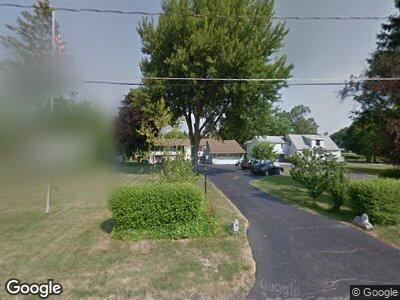
34 Admirals Walk Buffalo, NY 14228
Amherst NeighborhoodEstimated Value: $447,898 - $527,000
6
Beds
4
Baths
3,368
Sq Ft
$143/Sq Ft
Est. Value
About This Home
This home is located at 34 Admirals Walk, Buffalo, NY 14228 and is currently estimated at $480,975, approximately $142 per square foot. 34 Admirals Walk is a home located in Erie County with nearby schools including Sweet Home Middle School, Sweet Home Senior High School, and St Christopher Elementary School.
Ownership History
Date
Name
Owned For
Owner Type
Purchase Details
Closed on
Feb 26, 2024
Sold by
Neddy Joseph G and Neddy Mary S
Bought by
Zackey Kimberly Ann and Zackey Jordan Ryder
Current Estimated Value
Home Financials for this Owner
Home Financials are based on the most recent Mortgage that was taken out on this home.
Original Mortgage
$250,000
Interest Rate
6.94%
Mortgage Type
New Conventional
Purchase Details
Closed on
Dec 30, 2014
Sold by
Hensel Arthur A
Bought by
Neddy Joseph G and Neddy Mary S
Purchase Details
Closed on
Jun 8, 1999
Sold by
Oberacker Leon and Oberacker Marie L
Bought by
Neddy Joseph G and Hensel Arthur A
Home Financials for this Owner
Home Financials are based on the most recent Mortgage that was taken out on this home.
Original Mortgage
$128,000
Interest Rate
6.85%
Mortgage Type
Purchase Money Mortgage
Create a Home Valuation Report for This Property
The Home Valuation Report is an in-depth analysis detailing your home's value as well as a comparison with similar homes in the area
Home Values in the Area
Average Home Value in this Area
Purchase History
| Date | Buyer | Sale Price | Title Company |
|---|---|---|---|
| Zackey Kimberly Ann | $450,000 | Stewart Title | |
| Zackey Kimberly Ann | $450,000 | Stewart Title | |
| Neddy Joseph G | -- | None Available | |
| Neddy Joseph G | -- | None Available | |
| Neddy Joseph G | -- | None Available | |
| Neddy Joseph G | $160,000 | -- | |
| Neddy Joseph G | $160,000 | -- |
Source: Public Records
Mortgage History
| Date | Status | Borrower | Loan Amount |
|---|---|---|---|
| Previous Owner | Zackey Kimberly Ann | $250,000 | |
| Previous Owner | Neddy Joseph G | $240,000 | |
| Previous Owner | Neddy Joseph G | $25,000 | |
| Previous Owner | Neddy Joseph G | $128,000 |
Source: Public Records
Tax History Compared to Growth
Tax History
| Year | Tax Paid | Tax Assessment Tax Assessment Total Assessment is a certain percentage of the fair market value that is determined by local assessors to be the total taxable value of land and additions on the property. | Land | Improvement |
|---|---|---|---|---|
| 2024 | -- | $479,000 | $47,000 | $432,000 |
| 2023 | $11,092 | $280,000 | $33,600 | $246,400 |
| 2022 | $10,815 | $280,000 | $33,600 | $246,400 |
| 2021 | $10,455 | $280,000 | $33,600 | $246,400 |
| 2020 | $7,201 | $280,000 | $33,600 | $246,400 |
| 2019 | $7,116 | $280,000 | $33,600 | $246,400 |
| 2018 | $6,969 | $280,000 | $33,600 | $246,400 |
| 2017 | $2,959 | $280,000 | $33,600 | $246,400 |
| 2016 | $5,863 | $213,500 | $32,200 | $181,300 |
| 2015 | -- | $213,500 | $32,200 | $181,300 |
| 2014 | -- | $213,500 | $32,200 | $181,300 |
Source: Public Records
Map
Nearby Homes
- 3400 Niagara Falls Blvd
- 482 Old Falls Blvd
- 1745 Leah Dr
- 0 Crescent Dr
- 77 Waterway Ln
- 1329 Belling Place
- 1390 Sherwood Ave
- 245 Tonawanda Creek Rd
- 9 W Summerset Ln
- 148 Corsica Way
- 1330 Sisson Dr
- 1334 Dangelo Dr
- 1520 Kingston Ave
- 57 Florence Ln
- 238 Winterbrook Dr
- 625 Tonawanda Creek Rd
- 153 Florence Ln
- 3883 E Robinson Rd
- 3885 E Robinson Rd
- 864 Sun Valley Dr